Motor Efficiency Verification in Solar Pump Systems

已更新:8月26日
A solar pump motor efficiency claim is useful only when the input boundary, output boundary, operating point, temperature and measurement method are stated. In a photovoltaic pumping system, energy passes through the PV array or DC supply, controller, cable, motor, coupling and hydraulic pump. If a buyer divides water output by the wrong electrical input, or compares two motors at different speed and load, the resulting percentage cannot support model selection or supplier approval.
What should be included in a solar pump efficiency claim?
A defensible claim identifies exactly which efficiency is being reported:
Controller efficiency: true electrical power delivered to the motor divided by DC power entering the controller.
Motor efficiency: mechanical shaft power divided by true electrical power entering the motor.
Pump hydraulic efficiency: hydraulic water power divided by mechanical shaft power.
Wire-to-water efficiency: hydraulic water power divided by the defined upstream electrical input.
These values answer different questions. A high-efficiency motor can be installed on a pump operating far from its best-efficiency region. A capable pump can also be paired with a controller that loses efficiency at low irradiance or clips the available PV voltage. The most useful procurement evidence therefore reports component losses and system performance at the same stabilized operating point.
IEC 60034-2-3 specifies methods for determining losses and efficiency of converter-fed AC motors. Buyers should review the scope and applicable edition on the official IEC 60034-2-3 publication page. Mains-fed methods from other parts of the IEC 60034 series should not be applied automatically to a permanent-magnet or controller-fed solar pump motor without checking scope, waveform and test arrangement.
Define the measurement boundaries before testing
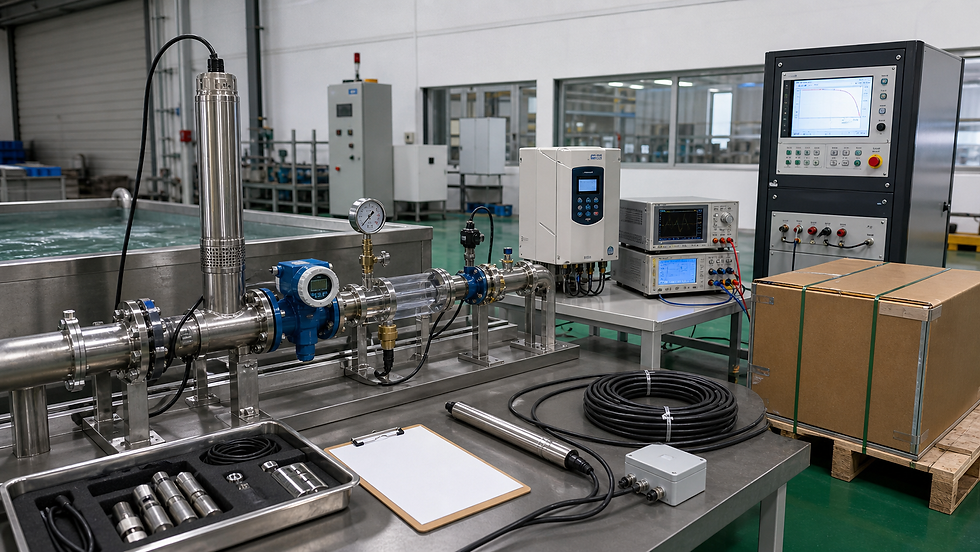
Draw a one-line energy boundary before connecting instruments. Mark these stations:
DC input to the solar pump controller.
Controller output at the motor terminals.
Mechanical shaft between motor and pump or dynamometer.
Hydraulic suction and discharge measurement points.
Water flow measurement point.
For a submersible pump, direct shaft torque measurement may not be practical on the complete wet assembly. A supplier can characterize the motor on a dynamometer and then test the complete pump hydraulically. The final report must keep those tests separate and explain how the motor, pump and controller configurations correspond.
True power must be measured with an instrument suitable for the controller waveform and switching frequency. Multiplying average voltage by average current can be misleading on pulse-width-modulated output. Record analyzer bandwidth, wiring method, sampling interval and whether reported power is DC, fundamental AC or total true power.
Speed should be measured rather than inferred from a controller setpoint. Torque sensors need an appropriate range, calibration status and alignment. Flow and pressure instruments should cover the expected operating region without spending the test near the bottom of their range.
Worked example: separate four efficiencies
The following numbers are an illustrative calculation, not RUTANPUMP product data. Assume a solar pump controller receives 1.50 kW of DC power at a stabilized duty point. A suitable power analyzer measures 1.38 kW of true power at the motor terminals. The measured shaft torque is 8.6 N·m and speed is 1,420 r/min.
Mechanical shaft power is:
Pshaft = 2 x pi x speed x torque / 60
Pshaft = 2 x pi x 1,420 x 8.6 / 60 = 1.279 kW.
Controller efficiency is:
1.38 / 1.50 = 92.0%.
Motor efficiency is:
1.279 / 1.38 = 92.7%.
Now assume the hydraulic test at the same duty point records a flow of 5.2 m³/h and total dynamic head of 42 m. Convert flow to cubic metres per second:
5.2 / 3,600 = 0.001444 m³/s.
Using water density of 998 kg/m³ and gravitational acceleration of 9.81 m/s², hydraulic power is:
Phydraulic = density x gravity x flow x head
Phydraulic = 998 x 9.81 x 0.001444 x 42 = approximately 594 W.
Pump hydraulic efficiency is:
0.594 / 1.279 = 46.4%.
Wire-to-water efficiency from controller DC input is:
0.594 / 1.50 = 39.6%.
These four results are internally consistent. They also show why a 92.7% motor figure does not mean that 92.7% of PV energy becomes useful water power. The hydraulic stage dominates the remaining loss at this duty point. If the pump is moved to another head or flow, its efficiency and the motor load can change even though the motor construction is unchanged.
The US Department of Energy's Improving Pumping System Performance sourcebook explains the value of field measurements of flow, head and motor power when assessing pumping-system efficiency. Its system perspective is directly relevant to solar pump acceptance: useful water duty is the final output, not a nameplate wattage.
Build a duty-point test matrix
A single best-case point is insufficient for a solar pumping system because irradiance and water level vary. Test at several defined points and keep the hydraulic resistance curve controlled. A practical matrix is:
| Test point | Controller input | Hydraulic condition | Required records | |---|---:|---|---| | Low solar input | 25% of rated power | representative head | DC power, motor power, speed, flow, head, stability | | Mid-load | 50% | representative head | same measurements plus controller temperature | | High-load | 75% | representative head | same measurements plus motor temperature | | Rated duty | 100% | specified flow and TDH | full efficiency calculation and protection status | | High-head check | limited to safe current | maximum declared TDH | flow, current, speed and thermal trend | | Low-head check | limited to safe flow | minimum declared TDH | flow, current, speed, cavitation or cooling observations |
The percentage must refer to a named boundary, such as controller DC input or motor shaft load. Do not mix percentages based on different quantities.
For each point, allow temperature and readings to stabilize under a written criterion. For example, a project may define stability as less than 1 K change over 15 minutes, provided the instrument sampling and motor thermal time constant make that criterion meaningful. Record inlet water temperature, ambient temperature and cooling arrangement because submersible motor losses are removed through the surrounding water and pump flow.
Account for uncertainty
Efficiency is a ratio of measured quantities, so instrument uncertainty affects the result. Suppose the power analyzer uncertainty at the test condition is ±0.5%, torque is ±0.5%, and speed is ±0.1%. A simple root-sum-square estimate for the shaft-power measurement contribution is:
sqrt(0.5² + 0.1²) = 0.51%.
Combining shaft power and motor-input power gives an approximate motor-efficiency measurement contribution of:
sqrt(0.51² + 0.5²) = 0.71%.
This estimate does not include alignment, temperature correction, waveform limitations, repeatability or data synchronization. The report should state a realistic uncertainty or tolerance and avoid claiming more decimal places than the method supports. A measured difference of 0.3 percentage point is not meaningful if expanded uncertainty is larger.
Repeat at least one central duty point after the full sequence. If the repeated result moves materially, investigate temperature drift, sensor zero, coupling alignment, hydraulic instability or controller settings before averaging the numbers.
Verify the electrical test setup
For DC input, place the voltage measurement at the controller terminals and the current sensor in the same boundary. Long PV cables create loss; decide whether the claim includes or excludes those cables. If field cable loss is part of the acceptance requirement, measure voltage at both ends under load and report conductor size, length and temperature.
At the motor side, verify phase or conductor connections, analyzer configuration and current-sensor direction. Controller-fed motors may have non-sinusoidal voltage and current. The selected analyzer and probes must be designed for the expected common-mode voltage, frequency content and voltage slew rate.
Freeze controller firmware, motor-control mode, switching frequency, current limits, acceleration settings and MPPT parameters for the test. A later firmware or parameter change can alter efficiency, acoustic behavior, startup and protection. RUTANPUMP's MPPT startup troubleshooting guide provides a structured method for checking PV voltage, loaded behavior and controller startup before an efficiency run.
Verify hydraulic output correctly
Total dynamic head should include measured suction and discharge pressure difference, elevation terms and velocity corrections where applicable. For borehole installations, account for pumping water level rather than static water level. Use calibrated pressure transducers or gauges at defined locations, and convert values consistently.
Flow meters need adequate straight pipe, a full pipe and a suitable fluid profile. Air entrainment, partially filled pipes and pulsation can corrupt readings. When a test tank method is used, document tank geometry, level interval and timing.
Do not compare motors using different impellers, pump stages or throttling arrangements unless the objective is complete-system comparison. Record the exact pump hydraulic configuration and direction of rotation. A wrong rotation can still produce flow while creating a false efficiency result.
For a broader witnessed release process, use the solar pump factory acceptance testing protocol to connect efficiency data with serial identification, hydraulic duty points, protection tests and deviation closure.
Acceptance criteria for an OEM purchase
A purchasing specification should state:
motor and controller model, revision and firmware;
rated and test speed, torque, voltage, current and temperature;
efficiency definition and exact input/output boundaries;
applicable test method and any justified deviations;
duty-point matrix and stabilization rule;
instruments, calibration validity and uncertainty;
hydraulic configuration, flow and TDH tolerances;
sample count and repeatability requirement;
report fields, raw data format and witness requirements;
change-control rules for windings, magnets, bearings, controller hardware and firmware.
Do not accept a certificate that shows only a percentage and model family. The evidence should identify the tested unit, date, configuration, operator, instruments and raw measurements. Production control can then use a shorter routine test correlated with the full type test.
A distributor should also define what happens when a sample misses the criterion: retest rules, root-cause analysis, corrective action, approval authority and whether shipment is blocked. The pre-shipment inspection guide helps turn those requirements into traceable release evidence.
Commissioning checklist
Before accepting field performance:
Confirm model, impeller or stage count, controller firmware and parameter file.
Measure PV open-circuit voltage only under a safe procedure, then record loaded DC voltage, current and power.
Verify motor current, speed or frequency and direction of rotation.
Measure pumping water level, discharge pressure, flow and pipe configuration.
Calculate TDH, hydraulic power and wire-to-water efficiency using synchronized readings.
Run long enough to identify thermal drift and water-level drawdown.
Repeat the principal duty point and compare it with factory data within the agreed tolerance.
Save raw values, photos, serial numbers, instrument details and deviations.
If field wire-to-water efficiency is low but motor electrical behavior is normal, inspect head calculation, flow measurement, pipe loss, impeller condition and pump operating point. If motor efficiency appears low, verify analyzer configuration, waveform capability, torque and speed calibration, temperature and controller settings before declaring a motor defect.
Frequently asked questions
Is motor efficiency the same as solar pump system efficiency?
No. Motor efficiency covers electrical power entering the motor and mechanical shaft power leaving it. System or wire-to-water efficiency includes controller, motor and pump losses and uses hydraulic water power as the output.
Can voltage and current alone determine motor efficiency?
Not reliably. Controller-fed motors require true input power plus measured mechanical shaft output. Voltage-current multiplication can be wrong when waveform, power factor or phase relationships are not properly measured.
Why must the motor be thermally stabilized?
Winding resistance and losses change with temperature. A cold test can overstate performance compared with continuous operation, so temperature and stabilization criteria must be recorded.
What should an OEM buyer require in the test report?
Require unit identity, configuration, firmware, duty points, raw electrical and mechanical or hydraulic data, temperatures, instruments, calibration status, uncertainty, calculations, deviations and approval signatures.
Contact RUTANPUMP
RUTANPUMP / Wenling Jingzhan Mechanical & Electrical Co., Ltd. Email: sales@rutanpump.com WhatsApp / WeChat: +86 18267835331 Tel: +86 (0576) 86322398 Website: https://www.rutanpump.com/


留言